Microsoft Power BI is an interactive data visualization software where we store our reports, visualisations and business intelligence data. One of the important data that we visualise in Power Bi is from Dynamics 365. Our student metrics, the enrolments, attendances, invoices and completions are visualised in Power Bi. In this article we will go through with one of the reports to show you how to get started with Power Bi.
- The first step is to go to https://myapps.microsoft.com.
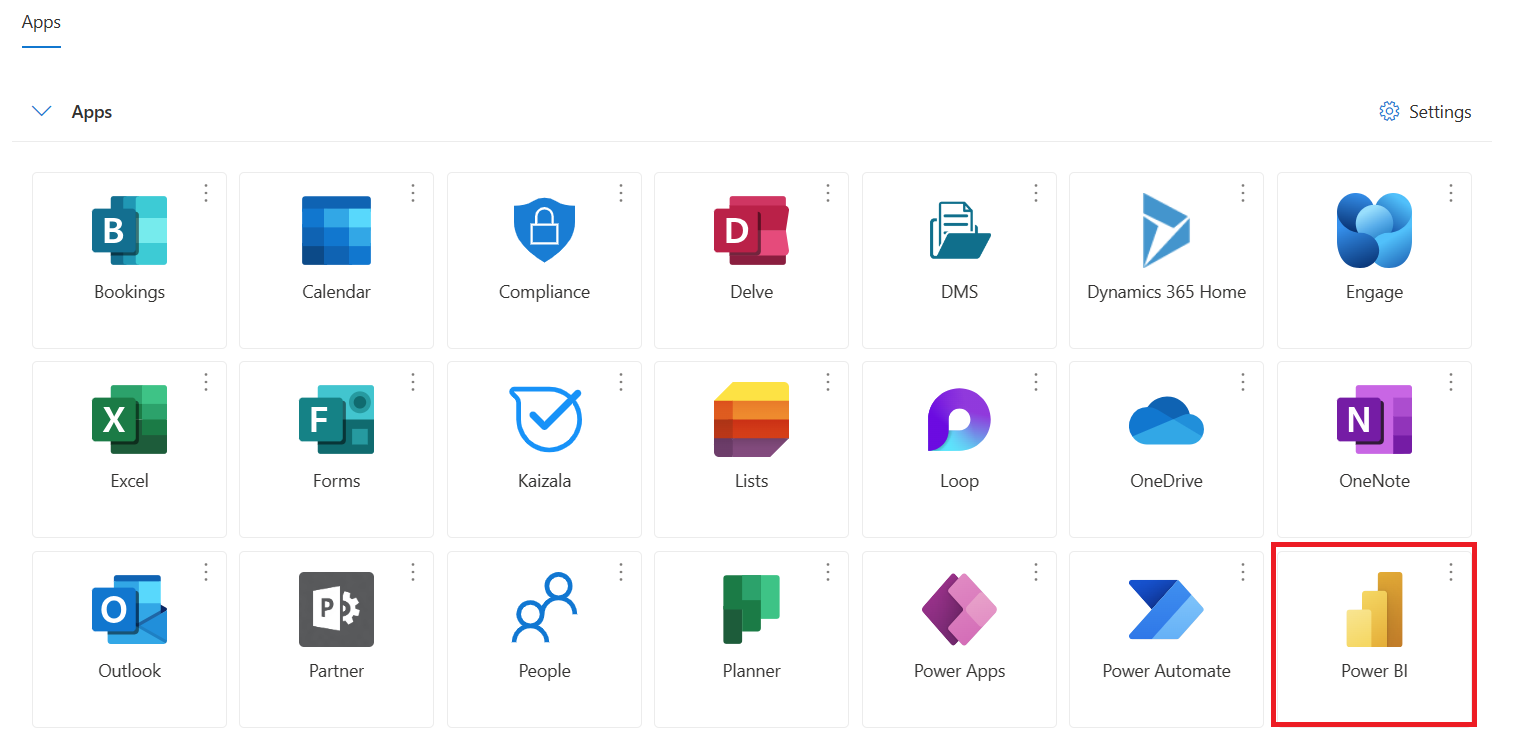
- Log in and from the list of apps, select Power Bi.
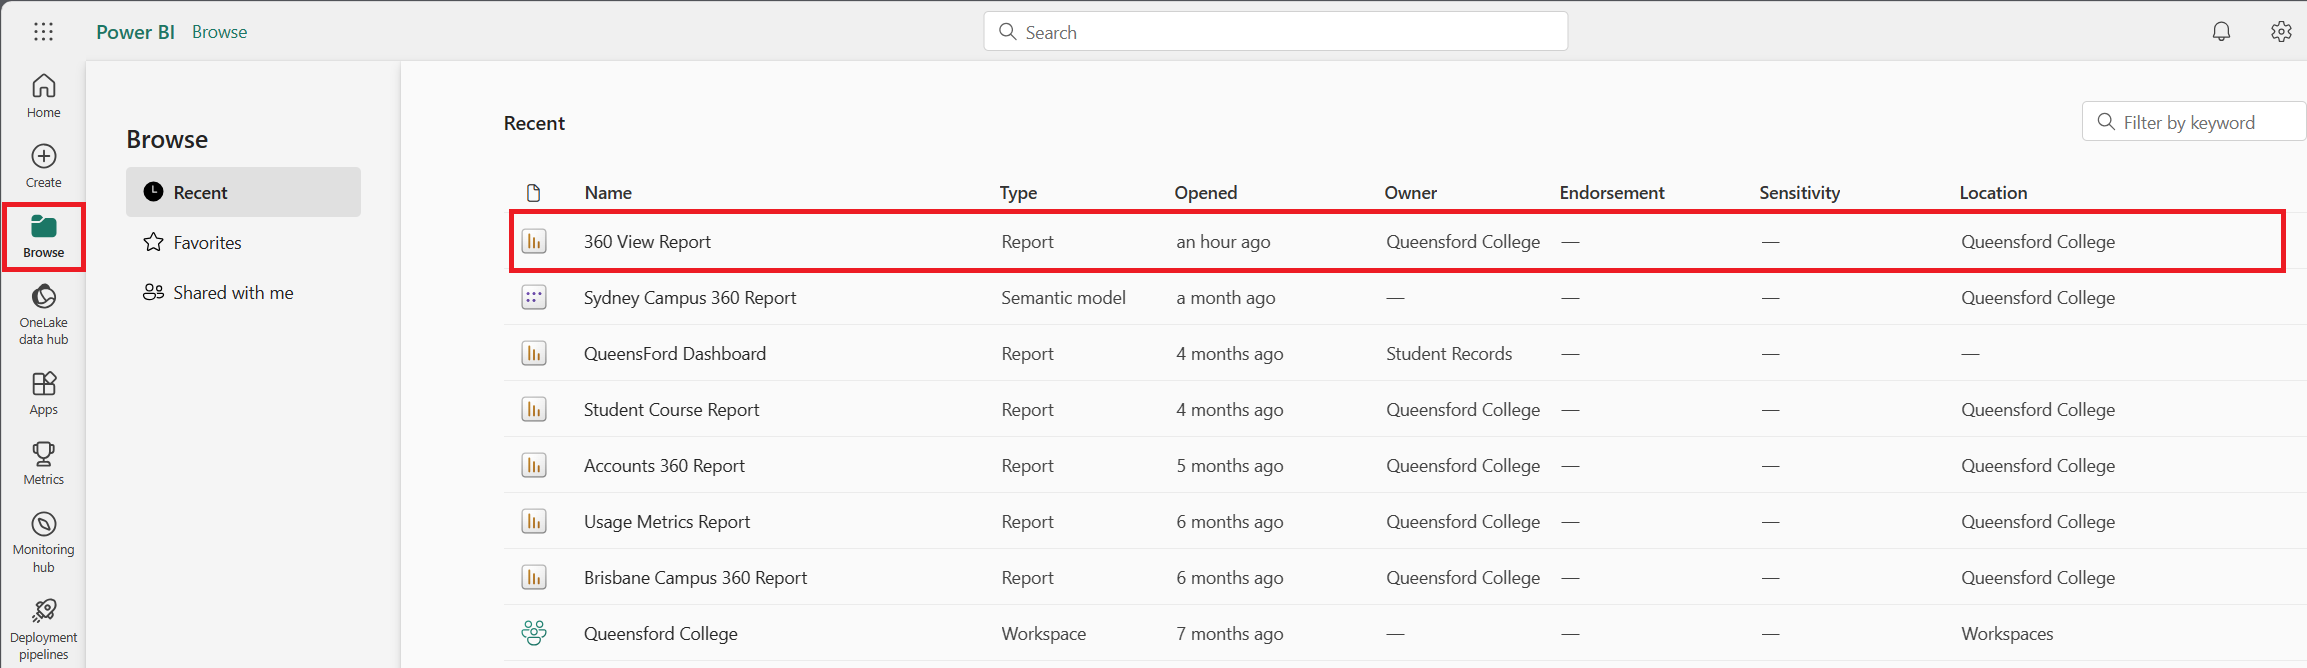
- Click on Browse to see the list of reports that you have access to.
- Click on 360 Report.
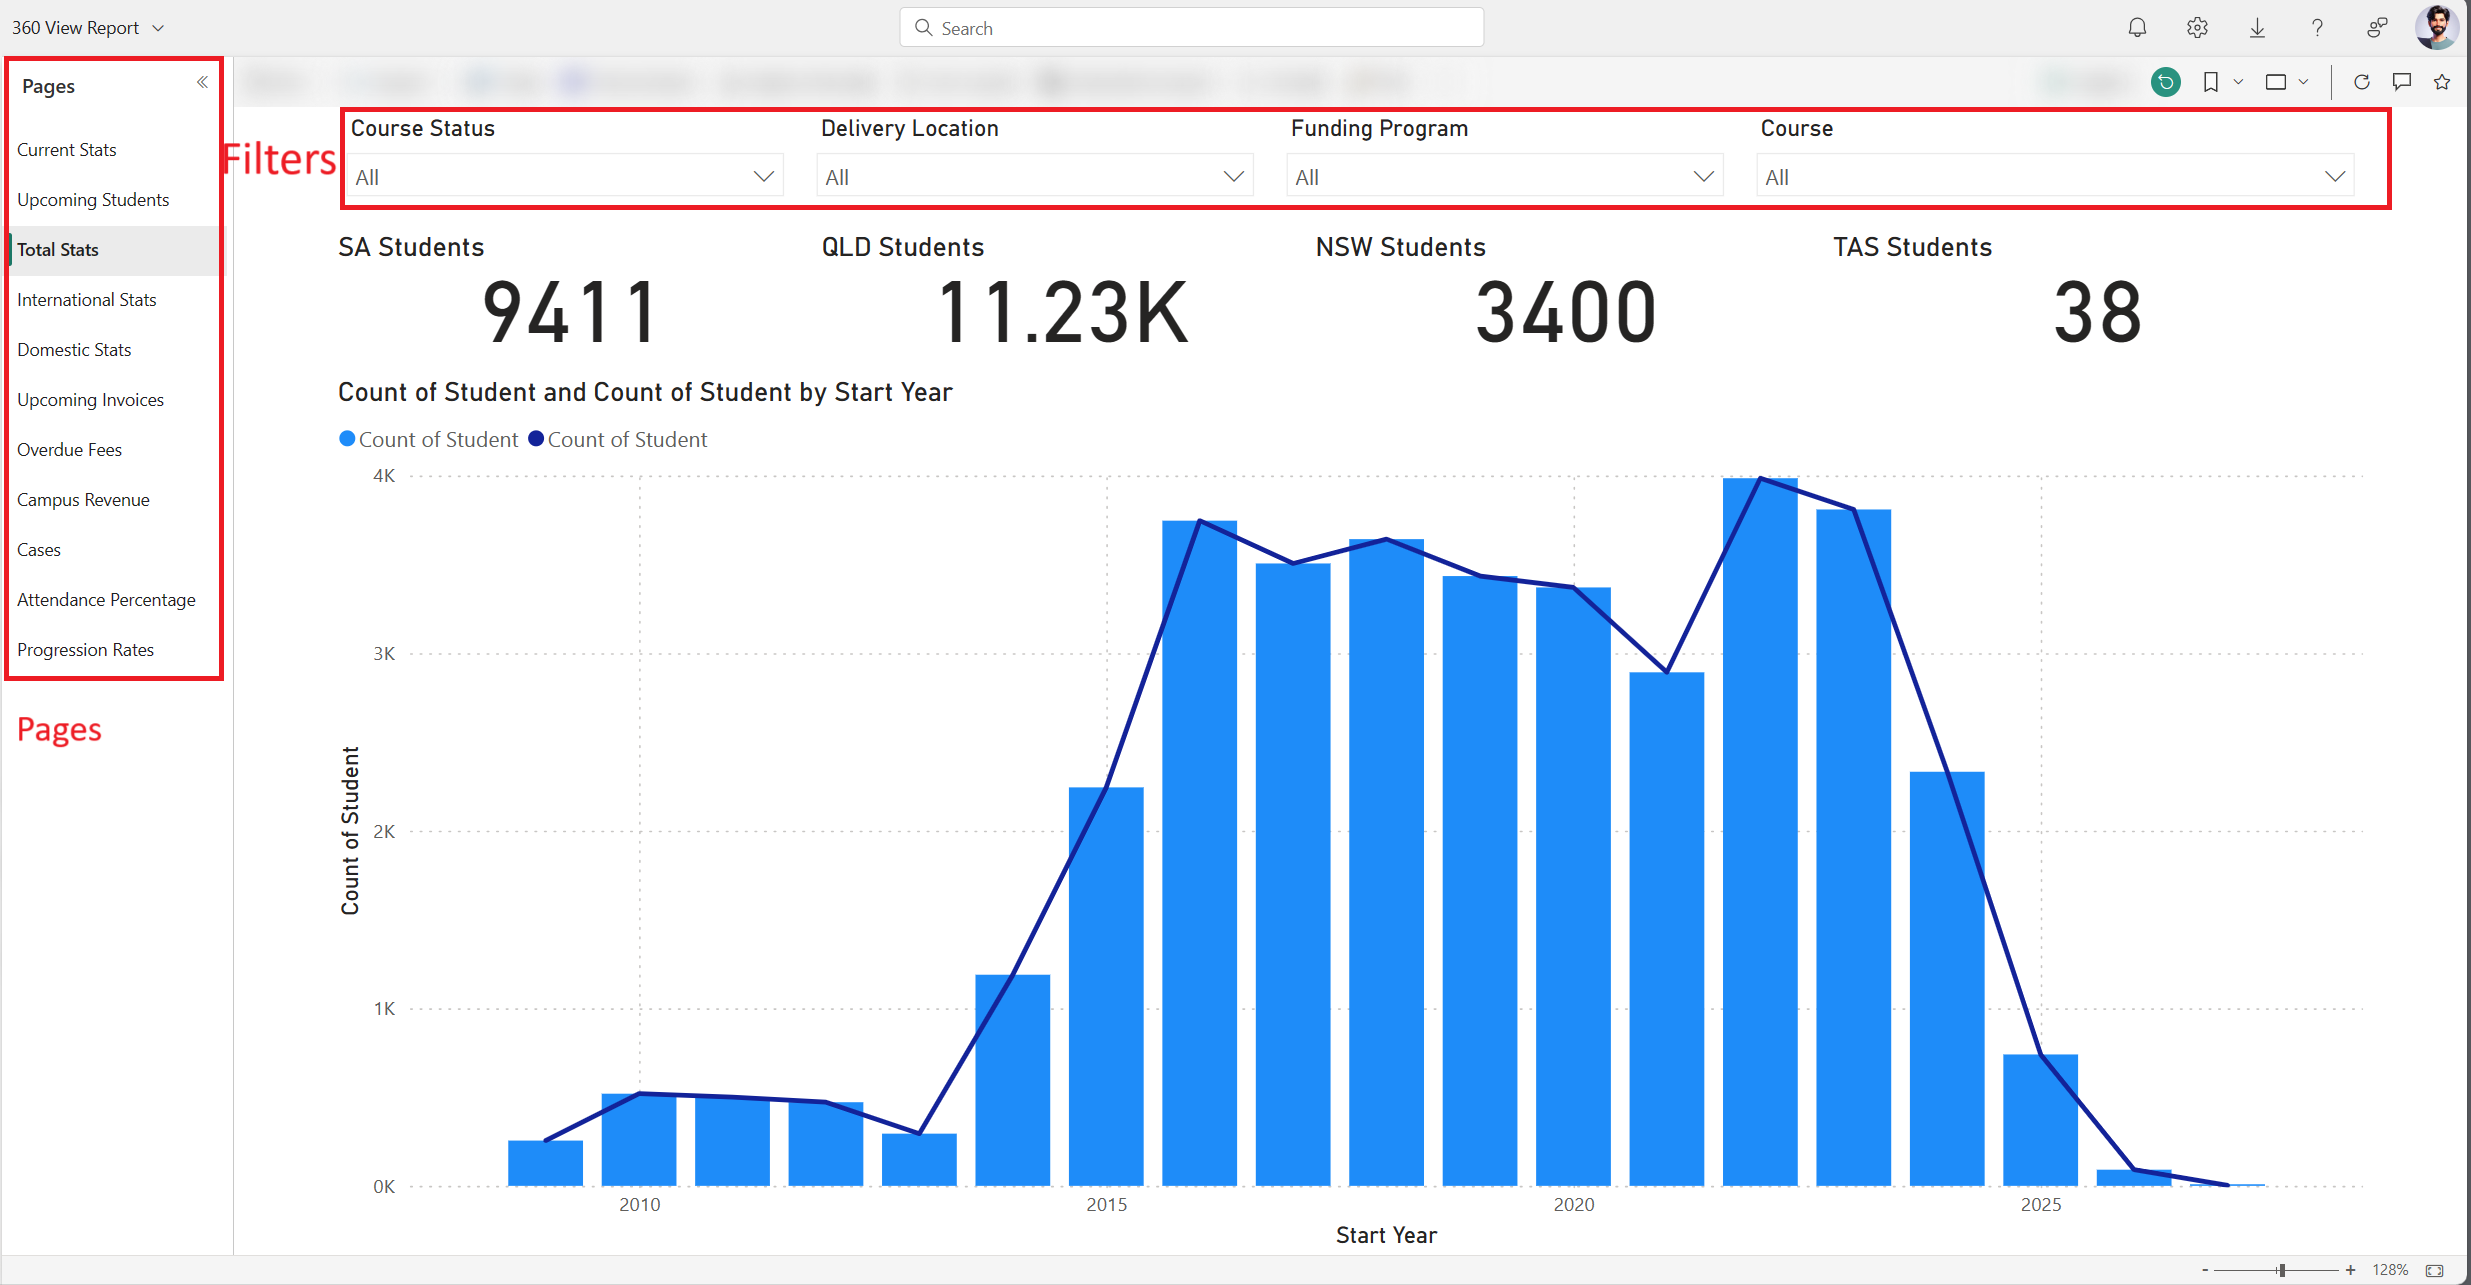
- You can then view your report, use the filters and switch between pages of reports to see different data.
Video instruction: